If you’re evaluating the performance of a live free-to-play game, then you are probably looking at 2 related – but very different – types of metrics. On the one hand, there are cohort metrics. On the other hand, live ops metrics. Each one of those metrics addresses a different aspect of the business and carries very different assumptions on how to analyze and model monetization. The purpose of both metrics is to analyze and help predict future behavior. But they are based on different assumptions and approach the performance of free-to-play games from a totally different angle. In the case of cohorted metrics you look at who is going into the funnel (installing the game) and when they are entering it. In the case of live ops metrics, you are looking at who is actually in the game today and how they behave when they are active – you don’t look at where they came from.
The main idea here is that both types of metrics have a different use and functionality. In other words, both metrics serve to make different types of decisions. You should be looking at LTV to determine your UA and growth strategy. And only that. Your LTV helps determine your UA spend – to what point can you continue investing profitably in your game. When it comes to forecasting bookings or determining how much to invest in operational costs, you should be considering live Ops metrics such as monthly active users (or customers) or average revenue per monthly active user.
Cohorted metrics
A cohort-based metric considers the behavior of each individual install. That behavior – it can be retention, dollars spent, number of games played, or anything else that’s relevant for you – is then considered within a given time frame since install. How much money does a player spend on average within 7 days of install? What is the redeposit rate 30 days after install? What percent of installs return to the game 30 days after install, 180 days after install? On average, how many PvP matches does a player play within 3 days of install, etc.
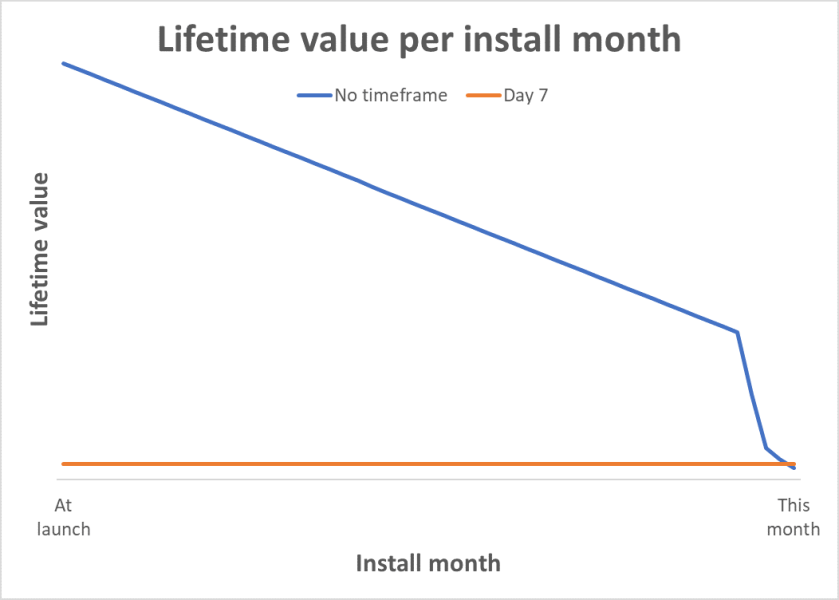
Of course, you can look at cohorted metrics without specifying a time frame. But if you don’t specify a time frame for your cohorted metrics you are losing comparison power. For example, the lifetime value will vary greatly for someone who only has installed 3 days ago and for someone who installed 3 years ago: the lifetime value will (generally) be higher for users who installed a long time ago compared to recent installs. That’s not because they are better performing users, or because your game got worse over time. It’s because they have a longer lifetime (and more time for potential spending). So, changes in lifetime value would reflect the aging of your install base rather than changes in your game and the way it performs. That’s why you want to specify a time frame when looking at cohorted metrics.
Because there are big variations in player behavior depending on the country and platform – especially for monetization and spending behavior – you need to make sure when you are looking at cohorted metrics that they are defined in terms of a specific country and platform (and probably UA source as well). The day 7 LTV will not be the same for a player in the US and a player in a tier 3 country. So, for example, you probably want to be looking at day 7 LTV for US/iPhone/organic installs rather than simply day 7 LTV for all installs considered together (or “blended”). If you are looking at a blended LTV, any variation you might see could be due to a change in game performance. But it could also be due to a change in the composition of your installs – perhaps a feature caused an influx in installs from tier 3 countries, or your latest UA campaign had a sharp change in performance.
A cohorted perspective is forward looking. It only considers how things unfold relative to the install moment. Also cohorted metrics are “engagement-agnostic”. Cohorted metrics won’t distinguish players depending on whether or not they are active in the game – either a certain degree of activity or active on a given day after install. All installs are considered equally, and the only crucial moment considered is the install moment. Stated differently, it doesn’t matter is your install is active on March 17th. What counts is that s/he installed February 17th, and that on aggregate you can expect a certain level of spending and engagement within 30 days of the install moment. Cohorted metrics help you anticipate what to expect from someone starting from the moment s/he installs your game. For every user installing, how much revenue can you expect on average after 7, 30, 360 days of install?
That’s why you need to rely on cohorted metrics to assess your UA spending and growth strategy. A marketing perspective and cohorted perspective are at the same level. When you spend on UA, you are presumably targeting a specific segment of users: country and platform. And once you’ve spent your UA money, it’s gone – you’ve committed to that spending, and nothing that happens after the install moment can alter the amount you’ve spent in the acquisition. Cohorted metrics are the type of metrics you need to take into account to determine your UA spending because they approach matters from the same perspective. They are forward looking from the install moment (which coincides with the UA spending). Cohorted metrics will help you determine how long it will take you to recuperate your spending after the user has installed/you spent your UA budget. It doesn’t matter at that point is the user is active or not day 7, day 30, day 90, etc. – it doesn’t matter in the sense that it’s part of the black box here. What matters is that you recoup your marketing investment by day 90, 180 or 360.
On the other hand, you can’t use LTV to determine how much revenue your game will generate on a given month. And that’s for 2 main reasons. First you probably don’t have reliable data on players’ spending at 180, 360 or 720 days after install. Even if your game has been live for 2 years and you have actual data, you probably don’t have data to reliably project the monetization performance of your installs that far ahead. And that matters because if your game is live for any extended period of time, your players with 1, 2 or more years of tenure will be in large part driving your monetization. Second, and as a result of this, you can’t just translate LTV into daily revenue without having all these uncertainties compound – thereby leaving you with very unreliable revenue numbers. And that’s even within short time frames. Let’s assume you know what your LTV curve looks like up to day 30.

From the LTV curve, you can assess how much revenue comes in each day per day since installs. And if you know how many installs you are bringing into the game every day (which your should) you can determine how much revenue you will make every day. On April 1st you’ll get the revenue from the day 0 LTV of your installs from that day. On April 2nd you’ll get the revenue from day 1 for your installs from April 1st and the revenue from day 0 for your installs from April 2nd. On April 3rd you’ll get the revenue from day 2 for your installs from April 1st, the revenue from day 1 for your installs from April 2nd, and the revenue from day 0 for your installs from April 3rd – and so on. If you were to model daily revenue based on LTV metrics, you would be looking at something like below:

In theory this is foolproof (just like any other math). But in practice this will not provide reliable results. Because you’ll end up compounding the uncertainty of the LTV for each day after install. This is already a problem short term. And it simply becomes unmanageable once you start looking at long-term monetization behavior. And as your title ages, a larger and larger portion of your revenue will come from elder players.
That means it’s very complicated to rely on cohorted metrics to make a robust business case and project your title’s performance mid to long-term. That’s why cohorted metrics are critical to think about your UA actions and growth strategy, but are not the best to make a business case, to think about EBITDA or opex. Your LTV is what will help you determine the extent to which you can profitably invest in marketing (and the timeframe you want to recoup your investment). But it’s not reliable enough to tell you what to expect in terms of revenue 6 months or a year (let alone 2 or 3 years) after install. And although most installs won’t be active in your game that long after install, those who will be are the most likely to be the ones accounting for a significant portion of your daily bookings. So precision and reliability on player behavior long after install matters.
Live ops metrics
Some examples of cohorted metrics are day 7 LTV, day 30 retention, day 1 conversion. Examples of live ops metrics are average revenue per daily active customer (arpdac), daily conversion rate, monthly active users, etc. Contrarily to cohorted metrics, live ops metrics don’t consider where players come from. It doesn’t matter when a player installed. What matters is whether that player is active in the game today. And all revenue considerations derive from looking at who is active on a given day, and how that engagement translates into revenue. At a fundamental level, cohorted metrics are much more about forward-looking regularities. Live Ops metrics are also about regularities. But they are more about “now” regularities: arpdau, daily conversion, customer concentration, engagement rate, etc. And those regularities are the key ones who need to look at when considering the revenue from your title.
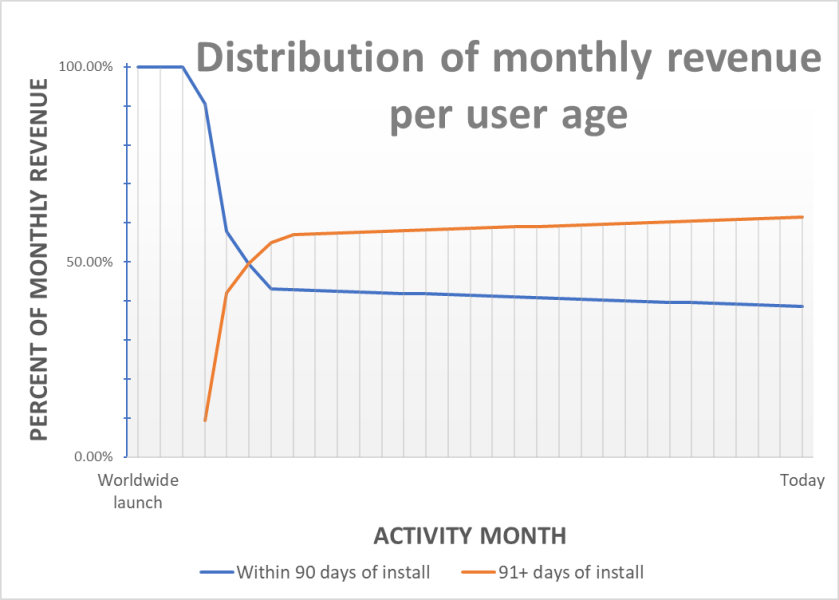
The longer your game has been live, the older the userbase. And the older the userbase, the older the players who are driving your revenue. That’s another reason why you want to be looking at live ops– and not cohorted – metrics for revenue. As your title ages, more and more of your revenue will come from your elder players. And cohorted metrics are not good in predicting the spend that will occur later on in the player’s lifecycle.
The regularities in live ops metrics are found at a higher level of aggregation and are also much more straightforward. And if your goal is forecasting, the simpler and higher level the model, the more reliable the output. That’s why it can be a good idea to look at monthly metrics. You should be observing strong regularities in the metrics, and you won’t be compounding too much uncertainty in the metrics. There are only 12 months in a year – so you’ll be compounding less error than if you do it for 52 weeks or 365 days. So, think Monthly Active Users or Customers; and average revenue per monthly active users/customers.
As mentioned above, when you are dealing with cohorted metrics, it’s important to control for a number of factors such as country, platform, UA source. When you are looking at your game’s daily performance, and Live Ops metrics you really need to be focusing on distinguishing engaged and non-engaged players. You can define that engagement in many different ways (the way Colopl does it is one example). Generally speaking, you can distinguish users based on a threshold of activity. If you are looking at live ops metrics on a monthly basis, a good way to divide up your players is: is it their install month or not? The reason for this is that all installs play your game at last once. And the first few sessions don’t reflect the same dynamics and levels of engagement as later sessions – where players are into your game, have made a habit out of it and are playing the way they want to (early player behavior is greatly conditioned by your tutorial and the way you hand tune the early sessions). If you look at early players, you might be looking at the behavior of players who are not into your game and won’t play it, or you are just observing the behavior determined by your first-time user funnel. And because a good majority of your installs won’t be playing your game after 3-7 days, looking at the activity patterns of your new installs can be misleading.
There is great consistency when it comes to the monetization performance of older users. The aprmau of a player who installed 6 months days ago won’t be fundamentally different from the arpmau of a player who installed 12 or 24 months ago (depending on your game you might want to exclude your golden cohort for this). The most significant difference has to do between “young” and “established” players – and also customer non-payer. You don’t need to segment your active user base at a lower level of detail than that. Once a player has stayed in the game long enough, the behaviors are relatively similar regardless of their tenure. When you look at arpmau, it’s consistently the same for your userbase, regardless if the average age for your MAU is 3 months or 15 months.

There is another important reason why you want to be looking at live ops metrics if you are focused on forecasting revenue. If you are managing a live game, you also know that there is only so much regularity in the metrics you work with on a daily basis. The spikes you are seeing in your game revenue are the result of contingent, ad hoc actions: an offer that performed specifically well, a new event that launched on a Friday instead of a Wednesday, etc. It’s not a cohort thing. It doesn’t have to do with the way an install performs 90 days after install. It’s a game thing. It has to do with that specific thing you did in-game March 17th – and that affected all active players the same way regardless of when they installed. Let’s say you manage an RPG and launched a new rarity of characters in March 2019. You can’t relate that back in a meaningful and statistically significant way to the day 720 LTV of your March 2017 cohort or to the day 360 LTV of your March 2018 cohort. It has nothing to do with the cohorts and the way they behave. It has to do with the game’s timeframe and the specific actions and events you are releasing for your active users.
The reality of the business is that you want a game that generates revenue and profit. You need UA in order to get users into your game and grow it – and to make sure your UA investment is spent profitably you need to be looking at cohorted metrics to control your spending. In order to forecast your revenue and determine the appropriate opex you need to look at live ops metrics. Looking at LTV or any other cohorted metrics is likely to cause noise – and a more unreliable result than if you look at the monthly monetization patterns of your active users.
To a certain extent, this also has an impact on the way you think about your day-to-day. If your goal is to generate revenue and profit, then you need to make sure you are acquiring users and not losing money while doing so (for that you look at LTV and other cohorted metrics). But your main business is not acquiring users and getting them in the funnel. You’re in the business of managing a live game and catering to your fans who are engaged and active on a daily business. You’re dealing with the exceptional few installs who stay in your game for the long run. The regularity/normal outcome at the cohorted level is to churn from your game. Managing a successful free-to-play product is all about live ops, about dealing with a userbase composed of players of different tenure and from different geos. And providing them with what they want to keep them coming in your game (and spending) on a regular basis.

4 comments