In this post I want to close the “engagement series” which ran across a few of my recent post by providing a template that you can easily reproduce on your end for the following metrics
- Lifetime cumulative days logged
- Lifetime login ratio
- Lifetime login ratio – retained users
- Lifetime login ratio – active users
- Churn of active users per days logged previous 7
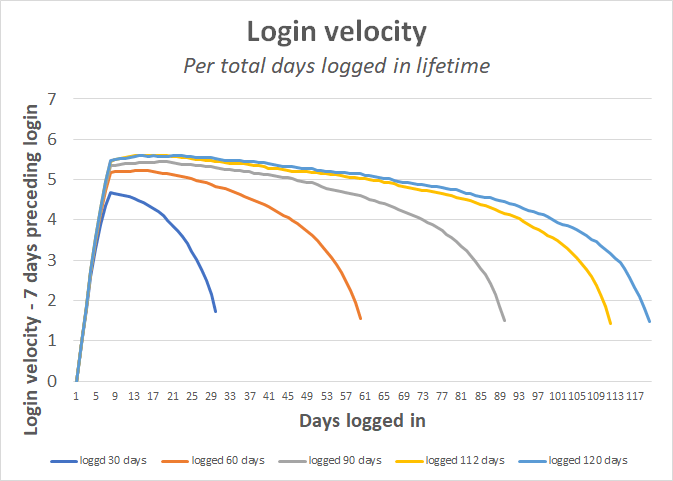
- Login velocity per total days logged in lifetime
Before jumping into this, I wanted to point to a recent post by a great friend and an ex-colleague of mine, Gavin Steininger. What Gavin has been doing is applying survivor analysis to multiple problems in the gaming space, including churn. Very briefly – and read his post for a better explanation – survival analysis is a great method to determine relevant thresholds of time. Survival analysis helps determine the relevant amount of time you should wait to consider a user as churned: what is the % of users who never return to the game after an absence of 3 days, 7 day, 14 days, etc. For each period of lapse, survival analysis will provide you with the probability that user will ever return. And survival analysis can be applied to any event you identify: churn, redeposit, or any other in-game action that might be relevant for you.
Now back to the query for lifetime engagement, login velocity and churn.
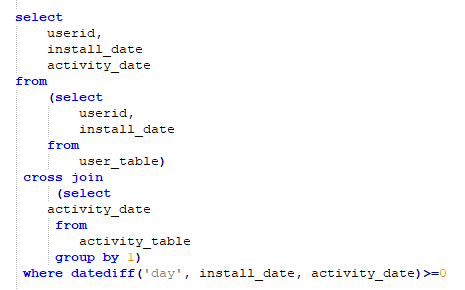
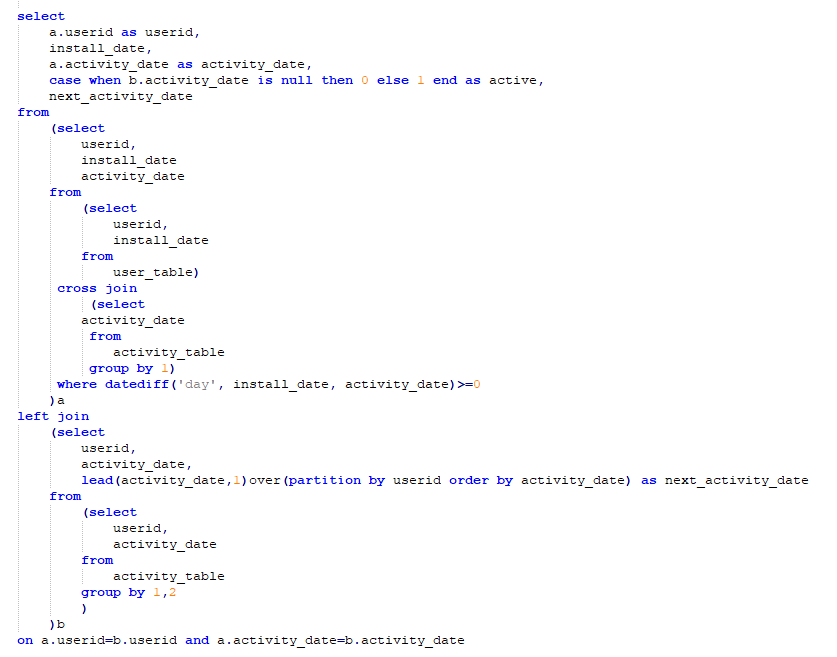
The first step consists in appending each potential activity date for users. Because there will be a record – regardless if there was activity on that date – this will provide the basis for cohorted metrics. Using cross join will save you the trouble of creating a join key to make the cartesian product yourself.
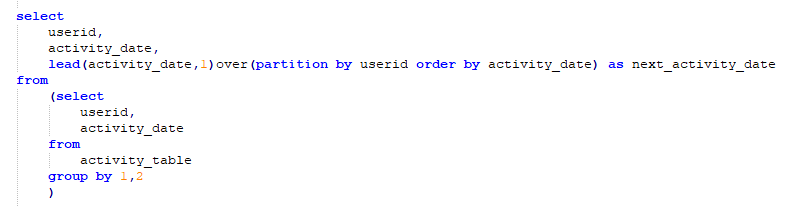
The second step consists in identifying each distinct day the user was active in the game – and for each active day the following active day (this will provide you with what you need to identify who is coming back within your relevant timeframe).
For the third step, you want to left join both tables on userid and activity_date. Left joining means you’ll have a record for every day of a user since install – and you’ll be able to identify for each day if a user has been active or not. That’s the “active” field I created with the case statement. So, this will provide the basis to recreate for your game both “cohorted” and “live ops” engagement metrics. You’ll be able to consider each calendar dates and filter out if you want to consider only active users (where active=1) or all users if you’re considering cohorted metrics.
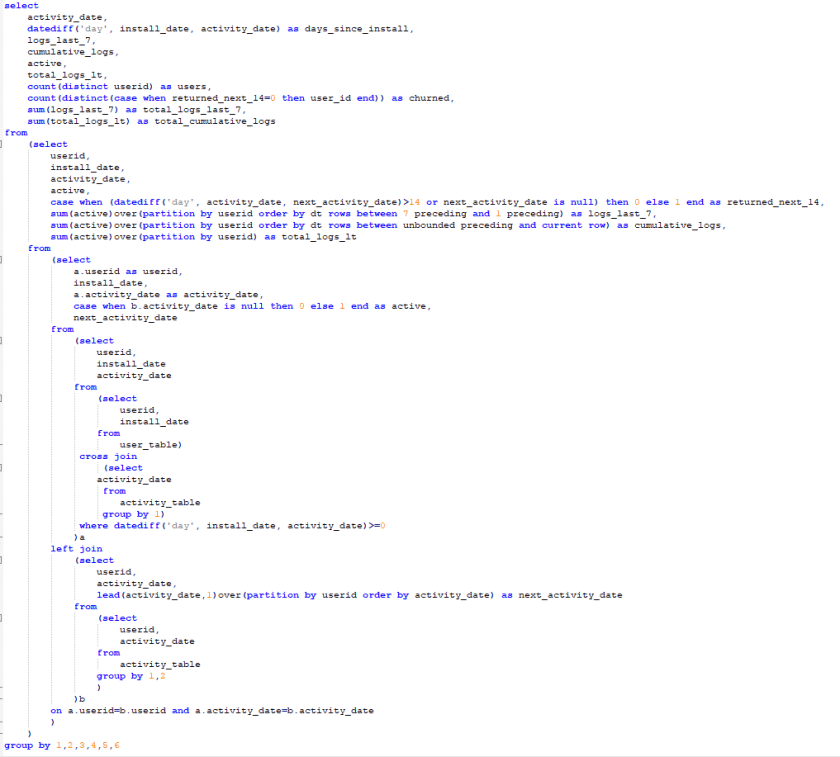
The fourth step is the important one: you will want to run a number of window functions to identify for each user and calendar date since install
- Has the user returned within the following 14 days (I chose to go with 14 days as the threshold for churn, but you go with what works best for you)
- How many days has the user logged in in the previous 7 calendar days
- How many days has the user logged in up to that point
- How many days has the user logged lifetime (at the time you run the query…)
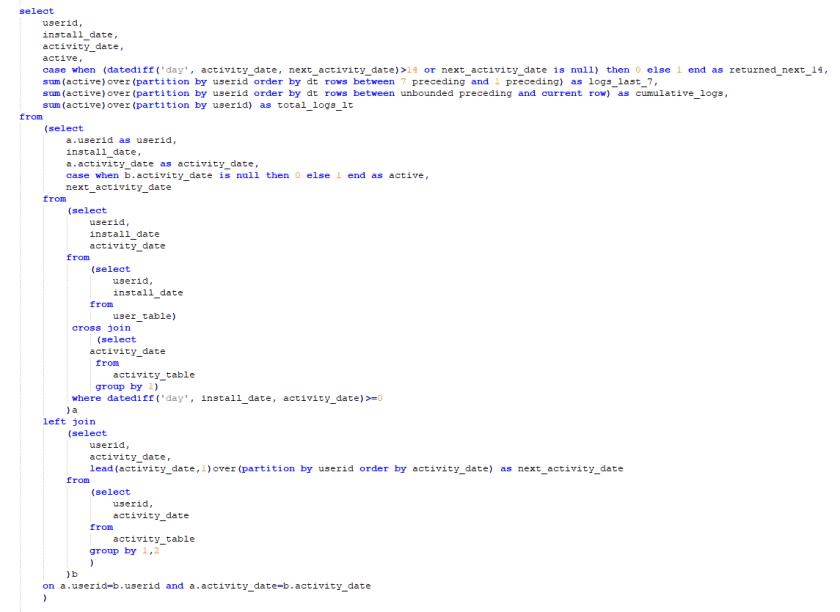
Once you have this step done, you can aggregate at the relevant level for you – and the specific question you are trying to answer. If you have a good visualization tool (and your game hasn’t been live for too long) you can run the query with all the relevant aggregations at once. But if your game has been live for long you might get too many records and not be able to process that. If you want to look at the login velocity throughout a user’s game life – the featured image of this post and what I was discussing here – you’ll need to aggregate on both cumulative_logs and total_logs_lt. Please feel free to comment here or reach out to me directly if you have any questions.