
Engagement and Live Ops
In my previous post I considered login ratio as a metric that provided a measure of the level of engagement of your users. A login ratio is the total number of days logged in divided by the number of days since install. In other words, it indicates the percent of total possible days a user has logged in 3 days after install, 15 days after install, 30 days after install, etc. If a user logged in 6 times within 30 days of install, his/her D30 login ratio is 0.2 (6/30). If 60 days has passed and the user hasn’t returned to game, s/he still only has 6 days logged in lifetime – but this time out of 60 days. So, the D60 login ratio goes down to 0.1 (6/60). Login ratio can be a useful metric to get a macro-level sense of the engagement patterns in a game and to compare the levels of engagement between different games.
However, when you want to switch perspectives and evaluate engagement from a live ops point of view there are better metrics to go with. When you look at lifetime login ratio, the values you are looking at are greatly impacted by the tenure of the users considered. The further back a user installed, the more potential days there are to not log in. That means the further back a user installed, the lower the login ratio. If you were to use lifetime login ratio as a metric to evaluate your active userbase, then it would most likely decrease after the launch of the game and plateaus as your active userbase “sediments” and ages. The only thing that might potentially make the lifetime login ratio of your active users vary would be an influx of new installs (new installs have a login ratio of 1 and that would make your overall login ratio go up). But that would require a significant influx of new users compared to your current userbase. So, aside from the cyclical dips associated with the weekends (less engaged users play on weekends) it’s unlikely you will come across any big variation. And if you were to come across any big variations, then it most likely would be reflecting changes in the composition of your active user base – not changes in the game itself.

I’ve briefly shared my thoughts on the differences between cohorted and live ops metrics [this is not just a question of semantics – both types of metrics imply radically different ways to think about the business and to approach the management and growth of a mobile game]. Because login ratio is defined as a cohorted metric: 1) the “activity unit” you are looking at is an install, and 2) the “activity timeframe” you are looking at is days since install. Everything is considered relative to install moment. Login ratio is a good metric if you’re adopting a “forward looking” perspective. It will consider all users whether they are active or not: how many days can you expect an install to log in within 30 days of install, within 60, etc.?
On the other hand, if you are focusing on live ops, you need a metric that is focused on the present, on the here and now: how many days have users actually showing up today logged in? If you’re operating a live game – releasing new content, running events and having sales – and trying to get a sense of the engagement of your active users, then 1) the “activity unit” you want to look at is active users – users actually showing up on a given day – and 2). the “activity timeframe” you are looking is activity date – the calendar of your Live Ops. Your revenue comes from this non-uniform userbase. There is little operational value in distinguishing active users who installed 30 days ago from active users who installed 180 days ago. What matters is they both showed up in your game while the event or the sale was running.
Live Ops and weekly engagement
Measuring engagement means measuring some form of movement. It’s not just about observing a heartbeat at time t – it’s about an activity flow. So that means you need to look at engagement over a period of time. The most natural timeframe when considering live ops is the weekly cycle. Consistently, more users are active on weekends (and retention of weekend installs takes a dip), less engaged users play on the weekends, retention has a 7-day cycle, and so does engagement. If you were to look at engagement on a daily basis, then it would be harder to disentangle the impact of this “day-of-the-week-effect” with the impact of game features and changes. Looking at engagement at a weekly level provides you with a way to control for the impact of the activity weekday and observe uniform and homogenous time periods. That’s why instead of looking at the engagement levels of your active users on a daily basis it makes more sense to approach it from a weekly point of view.
Another advantage of looking at weekly activity is that it’s tenure agnostic. It doesn’t matter is one user installed 3 years ago and another 3 weeks ago. As long as both users installed before the current week, they both have 7 potential days to log in during the week. Looking at weekly activity puts all active users on an equal footing.
There are three useful metrics to look at when considering the engagement levels in your live game: average days logged in during the week, average time played during the week, and next week return rate.
Average days logged in during the week
Logging in on a given day is a strong indicator of engagement. It illustrates users’ motivation to play the game and keep coming back to play it. One way to look at this is to see the average number of days a weekly unique user played. The average number of days provides a good overview to track the levels of engagement on your game throughout time. It also helps assess the impact on engagement of various changes in tuning or the addition of new features.

This can be particularly useful if you run events that require users to participate over the course of multiple days. Or if you introduce a recurring feature that provides an incentive to log in more frequently during the week (features such as weekly login bonus or leagues come to mind).
Average time played during the week
Average time played is very straightforward. Every week, what is the average time played by a weekly unique user.

Whereas average days logged in during the week looked at engagement from a “frequency” point of view, average time played represents the “intensity” part of engagement. This can be particularly useful to assess the impact of a new feature or game mode – do users spend more time in your app or do they simply shift their playing time? Did the time-limited event running that week encourage users to play more?
Next week return rate
Next day/week/month return rate is the live ops equivalent of retention. It looks at the percent of users active this week who will return next week. This is particularly important because it directly measures users’ propensity to continue logging in over time.

Most of the time next week return rate this can be the only way to assess the long-term impact on engagement of changes in tuning, progression or the introduction of new features. If you are affecting the end game, then retention will not provide you with any tangible insights – if your day 180 retention is 1% to begin with, it’s will be challenging to identify the impact of a late game feature on that metric (it’s unlikely any end game feature would double that). Not to mention the logistics issues associated with looking at long-term retention. Even if you could look at retention, can you wait 180 days to evaluate the impact of that new end-game feature you just introduced?
What weekly days logged in can tell you about your users
Looking at average days played provides an overall sense of how many days your userbase as a whole has logged in during the week. Another great way to look at days played is to divide you active users based on the number of days they logged in.
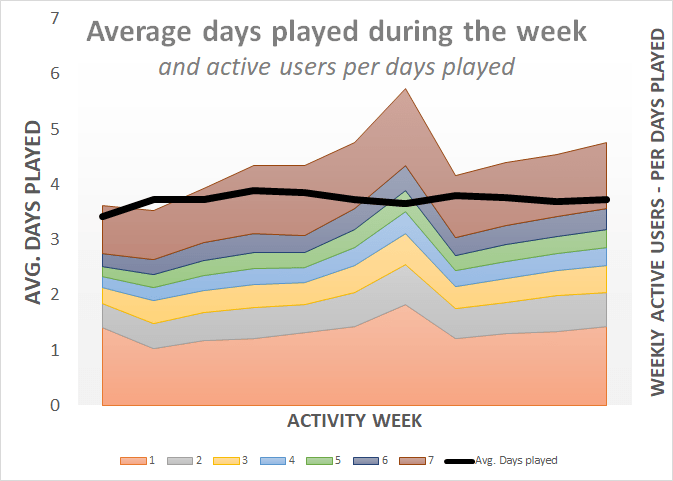
It’s a great way to highlight – from yet another angle – the fact that your game runs on your most passionate fans. On the exceptions (when looking at things from a cohorted point of view). If you were to distribute your users according to the number of days played during the week, you are most likely to see something that looks like a U-shape. The individual days most played are the extremes – the minimum and maximum.

Now if you relate weekly revenue to weekly engagement, it clearly appears your most engaged users – those playing every day – are the ones driving your revenue.

And this higher contribution to weekly revenue is due to the fact that these are the super fans keeping your game alive. It is not due to the fact that those users are logging in more frequently during a week. A day of a super engaged user is worth more than a day of a moderately engaged user.
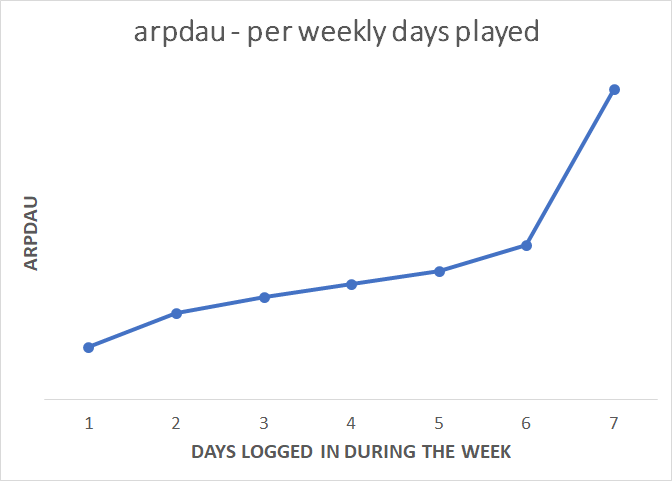
This happens with revenue and time played, customer concentration – pretty much any indicator you can use to assess the quality of your users. Looking at how many days a week a user is logging in is a great way to identify your most passionate users – it’s a way your most engaged users are “auto-identifying” themselves.
You observe the same thing when you look at next week return rate based on the number of days logged in.

This is very intuitive: somone who logged in every day of a week is more likely to come back the following week than someone who just logged in once. What’s interesting about it is this is a great way to detect higher risk of churn – and act preemptively. That will be the topic of my next post.

2 comments