
The previous post (you can find it here) discussed why redeposit rate is an important KPI and suggested 3 different ways to look at redeposit patterns in your game. These different ways to look at redeposit KPIs might provide you with novel ways to describe your game’s monetization patterns. More importantly, this week’s post will focus on how these 3 ways to look at redeposit KPIs in your game can be actioned upon.
The 3 different ways to look at redeposit patterns can be summarized as follows:
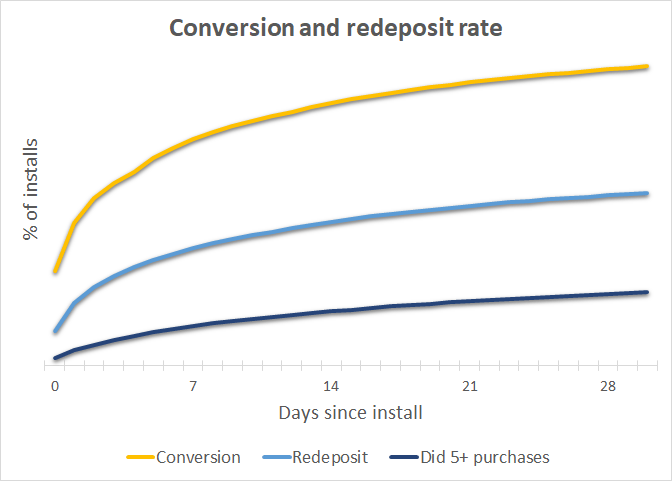
- Cohorted redeposit rate: just as day x conversion tells you what percent of your installs have made an IAP purchase within a given time frame, day x redeposit rate tells you what percent of your installs have made more than 1 IAP purchase within that time frame.
- Payers redepositing: how many purchases do your payers make within a given time frame? It’s important to know what percent of your payers will make a second IAP purchase, but it might be more relevant to know what percent of your installs make 3 purchases, 5, 10…
- Redeposit patterns: how long does it take your payers to spend again? At what price point are they spending? Do these patterns change the more transactions a payer does?
Whereas the first 2 can be very useful to assess the overall health of your game and provide you guidance during your soft launch phase, the third one can be particularly useful when designing features to get your payers to spend again.
A) Redeposit as a soft launch KPI
There are two key things you should be looking for during soft launch. First you want to be looking at metrics that will help you evaluate the performance of your game with a high level of confidence. You want to reduce the uncertainty that accompanies the decision to move forward with a worldwide launch or cancel a project. Second you need to get that high level of confidence as quickly as possible (which also means at a lower UA cost). Ideally you want things to move fast during soft launch. You want to clearly measure progress from one version to the next (that shows that you can correctly assess the situation and chose the appropriate response) – or stop investing in a title you are confident will not be successful.
That’s why it’s crucial to assess the key metrics for your soft launch strategy. Ultimately, you want to be looking at LTV. But unless you are dealing with very large volumes of installs (which is usually not the case in soft launch, unless you worked on Clash Royale or Brawl Stars), there is a lot of uncertainty in your LTV metrics and you can be at the mercy of a few outliers. The advantage of redeposit rate is that it provides you with a discrete and binary metric that provides more elaborate monetization insights than conversion alone, and that can be more reliable than LTV (at the very least cheaper to get with a higher degree of confidence).
Cohorted redeposit rate as a proxy for LTV in soft launch
If your game is a mega hit – or conversely, if your game is a clear dud – then you can probably see it confidently with very few high level KPIs. Leveraging analytics appropriately during soft launch is not a big challenge when your game is performing extremely well or extremely poorly. The challenge comes when you want to assess the viability of a title which might not be top grossing material, but which might still be performing well enough to be profitable (that’s the situation that justifies releasing the title worldwide and building on what you have to make it climb up the grossing charts).
If you are reskinning a game you operate, then the soft launch process can be relatively straightforward. You (hopefully) already know the ins and outs of your game, and a few very specific game metrics can let you know if you are on the right track. Ultimately, the business case for your reskinned title will rest on a comparison with the original. On the other hand, if you are releasing a new game, then you probably need to look at your day x LTV numbers to assess the viability of your game. One of the reasons why leveraging analytics appropriately in soft launch can be a challenge is specifically because LTV is a metric that requires a large volume of installs to assess precisely.
If given the choice between LTV and redeposit rate (assuming they both have a similarly high level of confidence), then you probably want to be going with LTV. But you will always need a lot more installs to get the same level of confidence with LTV. If there is too much uncertainty around your LTV metrics, then redeposit rate might be the next best thing. And clearly better than only relying on conversion. Just in the same way there is an incompressible amount of users you will never get to spend a dime in your game, there is an incompressible amount of payers you won’t succeed in getting to spend another time in your game (this is me being realistic, not pessimistic). If are only looking at conversion, then you are missing some key aspects of your monetization performance. For example, if the value proposition of your IAPs are too low or too high, that can affect your redeposit rate more than your conversion rate (your users need to have made the purchase to experience that).
It will always be “cheaper” (in time and/or UA $) to accurately measure discrete and binary metrics. In that respect, you will always be able to assess your redeposit rate much more accurately and with a higher degree of confidence than your LTV. From that perspective, cohorted redeposit rate can be a very useful KPI for your soft launch process. Looking at day x redeposit rate – in addition to conversion and retention – can help you have a more robust soft launch process. Also, during soft launch you want to iterate on your game and get results quickly. Chances are you will be able to compare more accurately your redeposit rate between version 0.1 and 0.2 than your LTV. It might not be as clear, straightforward (and reassuring) as making a decision based on LTV but redeposit rate will be a better indication than simply conversion to tell if you are on the right track.
Payers redepositing: craft your own game’s indicator and set yourself a target
You know that your payers redepositing will be the ones sustaining your title in the long run. That’s why it makes sense to look at the percent of your installs that is making 2+ purchases rather than only your conversion rate (the percent of your installs that is making 1+ purchases).
Looking at your payers redeposit patterns can help you set a tangible, measurable and custom target. There are 2 specific ways you can do that. First, look at your payers’ contribution to revenue: after how many IAP purchases do your users make a significant contribution to your revenue? In other words, how many transactions are required for you to consider a payer being a significant contributor (2 probably isn’t the answer)? Second, look at your payers’ redeposit patterns: after how many purchases is the “payer dropoff” stable? In other words, after how many purchases can you consider you are left with your “regulars” who will keep coming back and spending in a habitual fashion (again, 2 is probably not the answer)?
In the previous post, the following graph showed how you can distribute your payers according to the number of IAP transactions they have made. You can see both what % of payers has made that number of purchases, and their contribution to overall revenue.

Another way you can do that is look at the cumulative percent of total revenue per purchases. If you see that payers who do 4 or less purchases account for less than 25% of your revenue, then maybe you want to craft your own custom redeposit metric (what % of installs or payers do 5 or more purchases in a given time period)

Looking at dropoff rate in conjunction with revenue contribution can further help you define a custom redeposit target that makes sense for you. You can look at payer dropoff at each purchase – a bit in the same way you would be looking at the dropoff in your tutorial between sequential steps. If you consider making IAP transactions as a sequential process (first purchase, second purchase, third purchase, etc.) then payer dropoff is telling you what percent of payers making a purchase is not making the next one. This is a very valuable metric because the users who will be making the biggest contribution to your revenue are those who will make it a habit to spend at regular intervals – a bit in the same way that someone goes into a coffee shop on a regular basis to buy a cup of coffee. Below is the graph from the previous post

The natural tendency you should see when looking at your dropoff rate is that it will gradually lower as users make more purchases, and eventually flatten out. You will probably also need to make a tradeoff between how flat the dropoff is and how may users have got that far down the IAP funnel. In the example below the line is not exactly flat after 5 purchases (nor is it at 10) but considering about 25% of day 30 payers have done 5 or more purchases, it might be a good target. The important thing about looking at dropoff is that the moment you consider the line to have flattened out can help you determine the moment you want to consider a payer has become a “regular”.

Looking at payers redepositing – how many payers redeposit and how much revenue they account for – can help you define a custom redeposit metric that can help guide your soft launch decision. Just like you can look at your cohorted conversion and redeposit rate, you can look at your cohorted 5+ purchase rate (or whatever number of purchases makes sense and is relevant for you). The more transactions you want to look at the lower the percent of installs. But because you are still looking at a discrete and binary KPI, you should be able to assess your title’s monetization performance faster for less UA investment and with a higher level of confidence than if you were basing your decision on LTV.
B) How to leverage (and improve) your redeposit metrics?
Looking at actual redeposit patterns is the first step in improving your redeposit metrics. This is because I’m a firm believer in following the path of least resistance. Some patterns of behavior are generalized and found in all games. And the reason why those patterns can be found across any game – regardless of how different those games can be – is that they are grounded in the “natural” predispositions of your userbase (and not any specificities of your game). Behaviors become default behaviors because it’s what users are most predisposed to do. In other words, default behaviors reflect what is called in sociology of technology the affordance of mobile entertainment. You will always be more successful when trying to get users to do something they are predisposed to do. This is not about causing your users to spend or redeposit. It’s not about making your users do something they don’t want to do (or what you want them to do). It’s about recreating the environment most associated with the desired outcome (and letting “nature” take over).
Redeposit patterns fit this description. Regardless of the game, most redepositing users redeposit a) relatively frequently (every 48 hours or less) and at low price points. Trying to design features or offers that closely match these general behaviors is bound to be more successful because you are trying to adapt to what your users will be most inclined to do (so: the path of least resistance). So the best way to improve your redeposit rate is to focus on a) providing a reason for your users to spend a small amount frequently and b) provide an opportunity for your users to spend a small amount frequently
Reason to redeposit
Creating a reason to redeposit means creating a feature the user will want to engage with and that will be conducive to him/her spending again. The specifics of the implementation (is it a PvP or PvE event, individual or clan based, etc.) will be what makes users wan to engage with the feature more or less. There is an infinite number of ways you can design and implement this part of the equation. What is more straightforward concerns the “conducive to spending” part. If for example you observe that the natural tendency of your regular payers is to make a $4.99 purchase every 24 or 48 hours, then that helps you define the high-level features you need. At a functional level, you want to be designing a feature that is recurrent – that occurs every 24 to 48 hours. You also want to ensure that a $4.99 purchase can provide paying user with an improved experience. And although it’s not the topic of this post, it’s also best practice to offer different tiers of monetary engagement: $4.99 provides users with a better experience, and $49.99 even better, $199.99 top of the line, etc.
One recent example of this would be Blitz mode in Marvel Strike Force. Some blitz events only last 24 hour – those are the lackluster blitz events that events that provide users with token rewards. But the more engaging events last 48 to 72 hours. At the moment of writing this, these high-profile blitz occur twice a week, and provide the single playing payer with a reason to regularly spend – spending a bit during the event can help you get a better ranking and a better reward.
Opportunity to redeposit
The opportunity to redeposit refers to the material possibility of spending again. As long as you have a bank section in your game (and if you don’t, you have bigger priorities than redeposits…), that possibility is always present. “Creating an opportunity” refers here more specifically to an offer that would be proactively put in front of your payers. Knowing the frequency at which your payers are most likely to spend again and the price point at which they are most likely to spend also makes it much easier to design a compelling offer that caters to your payers preferences. Just like there are many different ways to go about and create a reason for users to engage with a recurrent feature, there are many different ways to design the specific contents of the offer. Actual payer beavior can help you determine the general structure of the offer as far as frequency and price goes.
One type of offers that can be particularly interesting to tune with this data in mind are piggy bank offers. In a sense, a piggy bank is a recurring offer that is gamified to provide a user with maximum value after a given action has been repeated a number of times. The price point part is very straightforward – you can just go with what your payers are accustomed to spend (or maybe slightly higher if you are trying to upsell a bit). In order to tune the “filling” part of the piggy bank, then you can ensure it occurs at the desired interval – say every other day. So, if you are managing a puzzle game and your normal payer behavior consists in collecting 20 stars a day, then you can make it so the piggy bank will fill up after 2 days of normal play (i.e. fills up after collecting 40 stars).
One last thing. Monetization features always depend more than engement features on the contingencies of each game – so you should make it a habit of testing and iterating on your offers. But if you are basing your feature and offer design on your payer’s actual behavior – how frequently are they spending and at which price point – then you are at least ensuring that your design will cater to your payer base’s needs and spending habits.

7 comments